What Does a CrUX Report Show for Your Website?
A CrUX report shows how real Chrome visitors experienced your page over 28 days: LCP, INP and CLS at p75. We checked 12 URLs: only 1 passed.
By — CTO, ERPFit
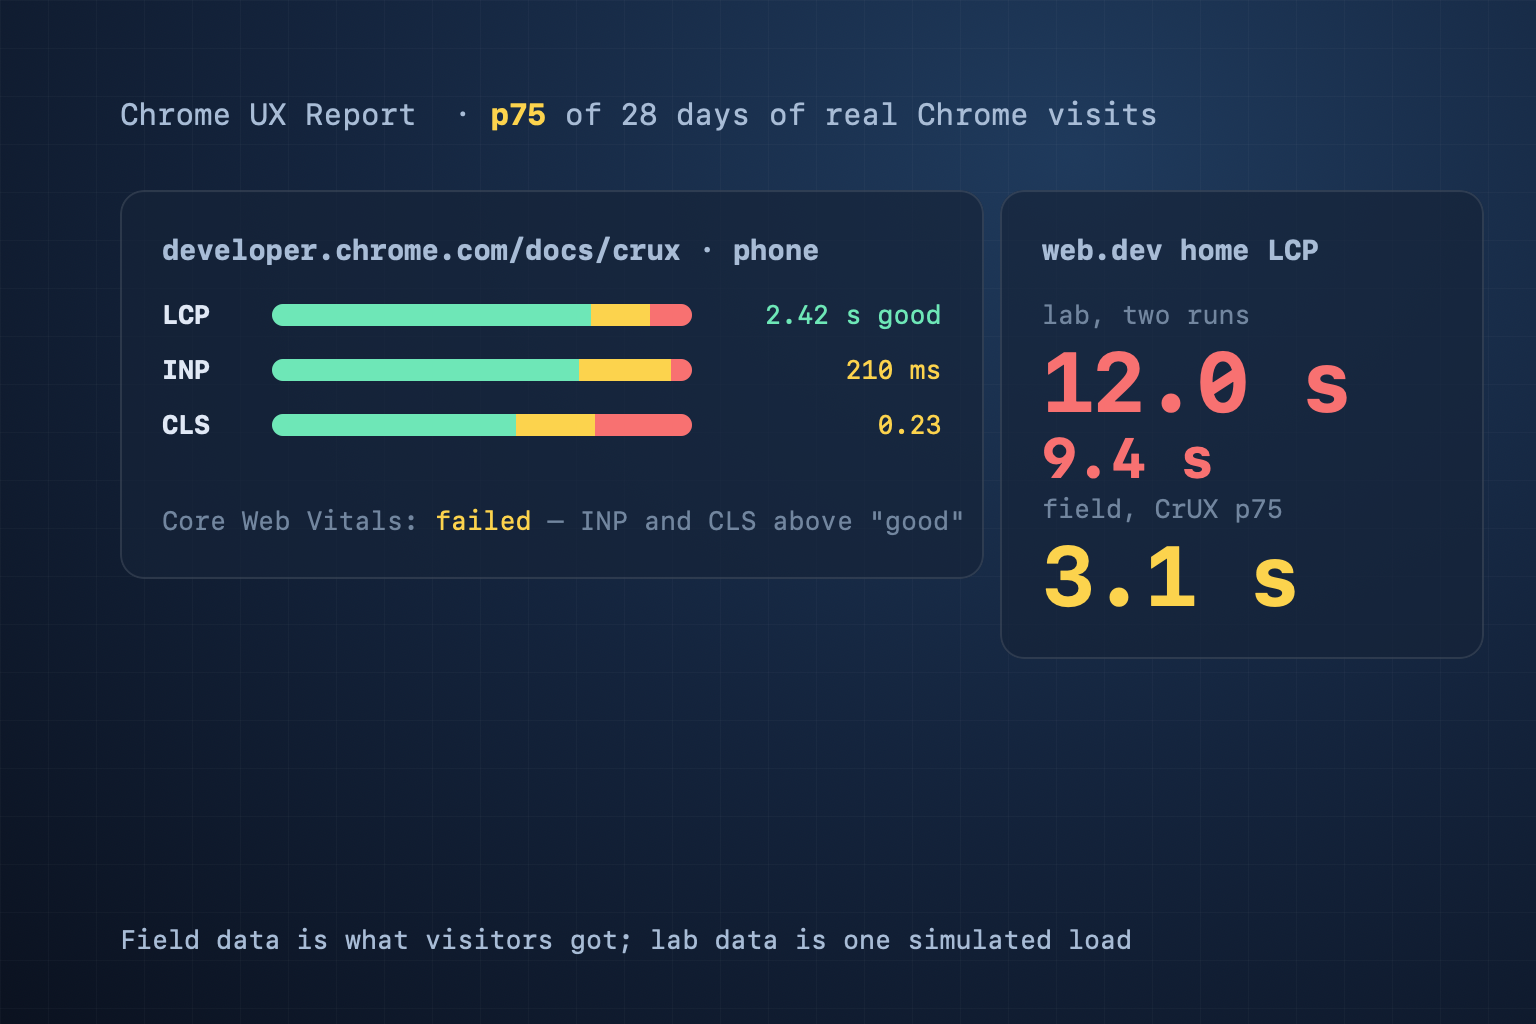
Short answer: A CrUX (Chrome UX Report) report shows how real Chrome visitors experienced a page, or a whole site, over the last 28 days. For each metric it gives the 75th-percentile value and the share of visits that were good, needed improvement or were poor: LCP, INP and CLS (the three Core Web Vitals), plus FCP and TTFB. A site with too few Chrome visits gets an empty report. Ours does too.
What is in a CrUX report
| Metric | What it measures | Good at p75 | Poor |
|---|---|---|---|
| LCP | When the largest element in the viewport appears | ≤ 2.5 s | > 4 s |
| INP | How fast the page responds to clicks, taps and key presses | ≤ 200 ms | > 500 ms |
| CLS | How much the layout shifts unexpectedly | ≤ 0.1 | > 0.25 |
| FCP | When the first content appears (diagnostic) | ≤ 1.8 s | > 3 s |
| TTFB | Time to the first byte from the server (experimental) | ≤ 0.8 s | > 1.8 s |
Thresholds: CrUX metrics and Web Vitals.
Each value is the 75th percentile (p75): 75% of visits were at this value or better. A page passes the Core Web Vitals assessment when LCP, INP and CLS are all good at p75. The report also splits by device (phone, tablet, desktop), and the CrUX API adds round trip time (RTT) and navigation types (reload, back/forward cache, prerender…). FID is gone: INP replaced it, and Chrome's tools stopped reporting FID in September 2024.
Whose visits count
- Chrome users who opted in: usage statistics reporting and browser-history sync turned on, no sync passphrase.
- Desktop Chrome and Chrome on Android. Chrome on iOS, Edge and Android WebView do not count.
- Public pages: HTTP 200 after redirects, no
noindexin a meta tag or anX-Robots-Tagheader. - Enough visits. Google does not publish the number; pages and origins use the same threshold (CrUX methodology).
So CrUX is a sample of your Chrome visitors, not all of them. A site whose visitors mostly use iPhones can have little CrUX data with real traffic.
Page data or whole-site data
CrUX keeps two levels: the page URL (query string and fragment removed) and the origin (every page of https://example.com). A page with few visits can have no data of its own while its origin has some. PageSpeed Insights then shows the origin's numbers, and Search Console groups similar URLs. The CrUX API does not fall back: a URL query returns that URL's data only.
Always check which level you are reading. On 26 October 2026 the github.com origin had a CLS of 0.06 (good) and the github.com home page 0.30 (poor). An origin that passes does not mean the page in front of you passes.
The 28-day window
The CrUX API returns the last 28 days, updated daily around 04:00 UTC. The CrUX History API returns weekly points, up to 40 weeks, and CrUX Vis charts them. BigQuery gets a new table each month, released on the second Tuesday of the next month. The result: a fix shipped today shows in full only after 28 days; in the first week p75 moves a little.
CrUX data for 12 real URLs (October 2026)
On 26 October 2026 we called PageSpeed Insights (mobile) for 12 URLs and read the CrUX part with the same parser a CiteStat scan uses. Values are phone p75.
| URL | Data for | Core Web Vitals | LCP | INP | CLS |
|---|---|---|---|---|---|
| web.dev/ | page | Failed | 3.06 s | 226 ms | 0.01 |
| web.dev/articles/vitals | page | Failed | 2.49 s | 162 ms | 0.11 |
| developer.chrome.com/docs/crux | page | Failed | 2.42 s | 210 ms | 0.23 |
| developer.chrome.com/…/dimensions | origin | Failed | 3.10 s | 251 ms | 0.21 |
| github.com/ | page | Failed | 4.21 s | 305 ms | 0.30 |
| github.com/…/issues/1 | origin | Failed | 2.36 s | 261 ms | 0.06 |
| en.wikipedia.org/wiki/Main_Page | page | Passed | 1.60 s | 131 ms | 0.00 |
| vnexpress.net/ | page | Failed | 0.86 s | 163 ms | 0.34 |
| tiki.vn/ | page | Failed | 1.24 s | 394 ms | 0.28 |
| citestat.com/ | no data | — | — | — | — |
| citestat.com/en/wiki/crux | no data | — | — | — | — |
| erpfit.com/ | no data | — | — | — | — |
What we took from it:
- 1 of the 9 results with data passes: the Wikipedia main page. Google's own CrUX docs page fails on INP (210 ms) and CLS (0.23).
- Of the 8 failures, 6 have CLS above 0.1 and 6 have INP above 200 ms; only 3 have LCP above 2.5 s. vnexpress.net loads fast (LCP 0.86 s) and fails on CLS alone.
- The two low-traffic URLs got origin data, as the PageSpeed Insights docs describe.
- Lighthouse moves between runs; CrUX stays put within a day. On the first run Lighthouse measured the web.dev home page LCP at 12.0 s, and 9.4 s on a second run about four minutes later; CrUX said 3.06 s both times. For tiki.vn: Lighthouse 12.5 s, then 12.7 s; CrUX 1.24 s.
- Our three URLs have no data, at page or origin level. That is normal for a small site.
TTFB p75 was good (≤ 0.8 s) on only 3 of the 9 URLs with data: vnexpress.net 0.31 s, tiki.vn 0.34 s, Wikipedia 0.79 s; the other six sat between 1.21 and 1.74 s.
Where to see your own CrUX report
- PageSpeed Insights: the real-user section at the top, 28 days, for the page, or the origin when the page lacks data.
- Search Console Core Web Vitals report: groups URLs with a similar experience; a group's status follows its worst metric.
- CrUX Vis: weekly history, up to 40 weeks. Google deprecated the CrUX Dashboard on Looker Studio in September 2025 (its data connector stops after November 2025) and recommends CrUX Vis instead.
- CrUX API and BigQuery: for developers; the API needs a Google Cloud key, BigQuery has monthly data back to 2017.
- A CiteStat scan: reads CrUX from the PageSpeed Insights call the scan already makes, shows the p75 and the share of good visits for each metric, says whether the data is for the page or the whole site, and gives the Core Web Vitals verdict. A failed verdict names the metric to fix first.
CrUX numbers in CiteStat are display only; they do not change the headline SEO score. Each scan saves them, so the trend chart on your dashboard shows them move from scan to scan. A free account gets 10 credits a day, and one SEO scan costs 1; the Agency plan adds recurring scans. See pricing.
Does CrUX affect rankings?
Google Search Central's page experience page (updated 22 September 2026) says: "Core Web Vitals are used by our ranking systems." The same page says there is no single page experience signal, and good scores do not guarantee a top ranking. Search Console judges Core Web Vitals on CrUX data, not on Lighthouse. Treat CrUX as the speed data Search Console uses; content and relevance still come first.
What to do
When the report is empty:
- Check that the page returns HTTP 200 and has no
noindex. - Check whether PageSpeed Insights has data for the origin. If it does, only the page lacks visits.
- Measure your own visitors with Google's web-vitals library and send the numbers to your analytics.
- Use Lighthouse to find problems, not to decide pass or fail.
When the verdict fails:
- Fix the metric with the fewest good visits first.
- CLS: set
widthandheighton images, reserve space for ads and embeds, do not insert content above what is already on screen. - INP: break up long JavaScript tasks, cut third-party scripts.
- LCP: cut server response time, preload the main image, do not lazy-load it.
- Wait 28 days and watch the weekly points in CrUX Vis.
To see whether your page or only your origin has CrUX data, run a free CiteStat scan — 10 credits a day, an SEO scan costs 1.
Frequently asked questions
Why does PageSpeed Insights show no real-user data for my site?
Because CrUX does not have enough visits from Chrome users who opted in, at the page level or the origin level. Google does not publish the threshold. The page must also be public: HTTP 200 and no noindex. Meanwhile, measure your own visitors with the web-vitals library and use Lighthouse to find problems.
Why is my Lighthouse result bad while CrUX is good (or the other way round)?
Lighthouse loads the page once on a simulated device with a fixed network; CrUX is the 75th percentile of every real visit over 28 days, on real devices and networks. On 26 October 2026, Lighthouse measured the tiki.vn home page LCP at 12.5 s while CrUX said 1.24 s. Search Console judges Core Web Vitals on CrUX data.
How long until a fix shows up in CrUX?
About 28 days for the data to fully reflect the fix. The CrUX API uses a 28-day window updated daily, so p75 moves gradually as older visits drop out. CrUX Vis plots one point a week (up to 40 weeks) so you can watch it.
Does CrUX still report FID?
No. INP replaced FID in the Core Web Vitals in March 2024, and Chrome's tools stopped reporting FID from 9 September 2024. A guide that still lists FID is out of date.
Sources: CrUX methodology · CrUX metrics (updated 13 October 2026) · CrUX API · CrUX History API · CrUX on BigQuery · CrUX Dashboard deprecation · About PageSpeed Insights · Core Web Vitals report · INP becomes a Core Web Vital · Google Search Central: page experience. Data: PageSpeed Insights v5, mobile, 26 October 2026.